DataCaster - Configure Display Screens, Connect Data & Go Live!

Rapid Screen Configuration with Powerful Formatting Options

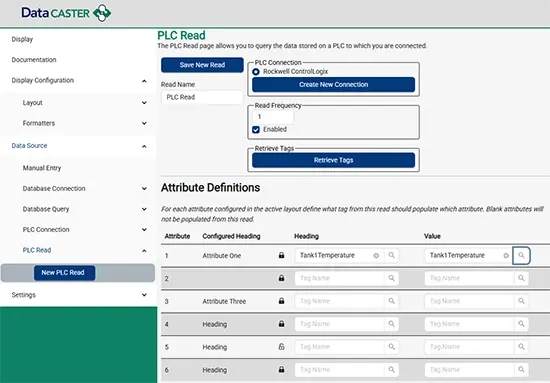
You've configured and connected DataCaster to your data sources, the last step is to use the browser UI to build screen layouts, then setup your reads and put them on your displays.

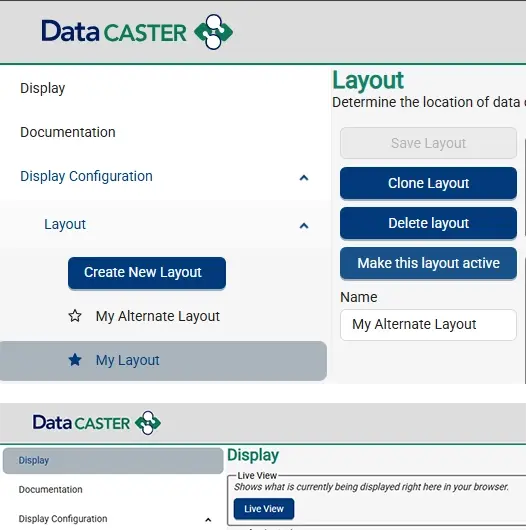
  • Define multiple layouts & cloning of layouts for rapid creation of alternate displays
  • Set active layout from config UI or via REST API command (time based screen rotation coming)
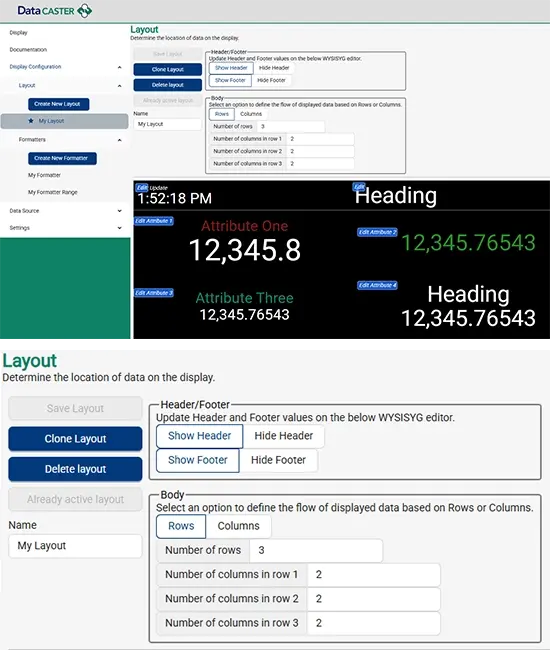
  • Preview as you build the layouts to see your results as shown here.
  • Page Header & Footer can be hidden or displayed
  • Header or footer fields can show text, date/time, or last date/time data was updated
  • Layout data in rows and columns 
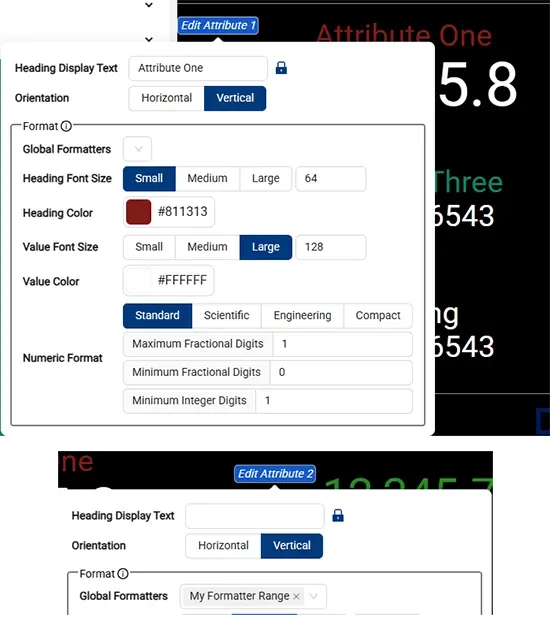
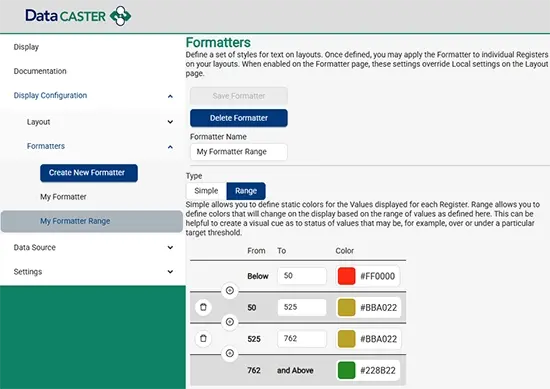
  • Format data font size, color, date/time format, decimals & more on individual values or attributes, or using Global Formatters you define to apply your standards
  • Lock Headings or allow dynamic change based on process data 

Formatting Your Data

Individual data values, "Attributes" in DataCaster, can be formatted individually, as shown here, with a wide range of options on how the data is to be displayed.  Alternatively Global Formatters can be defined (see below) and chosen to apply standards across your displays. 

  • Heading display above (Vertical) or next to (Horizontal) the attribute value
  • Font size, color independently for heading and attribute value 
  • Numeric data format multiple options with control over number of fractional digits (decimal places)
    • Standard
    • Scientific
    • Engineering
    • Compact 

Standardize & Speed Configuration with Global Data Formats

If you have common formats, including color change based on value that you want to achieve, use Global Formats that can be re-used across attribute display values.

Two types of global formatters are possible

  • Simple Heading & Value Font Size, Color, & Numeric Format
  • Range based formatter with multiple ranges possible as shown here

Setup Data Reads and Map to Display, then "Go Live!"

You've setup and connected the device, defined the data sources and tested connections, and now your display layouts are setup and formatted.

All you need to do now is go back and setup your reads of data if using a source where DataCaster requests the data. If you're going to push data to DataCaster with the REST API from another application then all you have to do is set your display active and go configure your REST client to push data!

In this example, we are using our PLC Connection to a Rockwell ControlLogix PLC and have setup a tag "Tank1Temperature" to display in Attribute 1.  

Because Logix family PLCs let you discover tag lists from the device, the Retrieve Tags button lets you read the tag list, and then pick a tag to map to an attribute.

Set Your Active Layout And Go Live!

Now just go back to Display Configuration and click the "Make this layout active" button, and you're ready.

You can test your work on your laptop in the browser config UI by going to Display and Clicking Live View as shown here. 

Otherwise you are now ready to mount your DataCaster and connect it to your display on the plant floor! 

DataCaster-Connecting-To-TV-500x127