DataHub System Monitor - Integrate System Health with HMI, SCADA, MES, & More

Empower Operations Technology (OT) Staff with IT health data

Try It

REQUEST QUOTE

Rapid, Visual Configuration 

DataHub's configuration tools are free and included in an integrated user interface with all the other features of DataHub.  Don't configure multiple software applications to make local system health available when DataHub can do it with all the other functionality you are leveraging in DataHub

System Monitor lets you quickly access your local machine's Windows system health statistics, filter & select what you want to read and at what update rate as shown here. 

Once configured all items are automatically available via OPC DA, OPC UA, for logging, notification, trending, etc, depending on what DataHub features you have licensed. 

Taking action using DataHub's built in Scripting Engine is free and included with the DataHub System Monitor Solutions Pack 

Using DataHub's Remote Configuration  capabilities, you can configure DataHub System Monitor instances on other systems. 

Try It

Aggregate & Monitor Multiple Systems

System monitor gathers system health data such as CPU usage, free disk space, available memory and whether critical processes are still running locally and exposes it to a local HMI at the machine or work cell or line level.  

Using DataHub mirroring/tunneling, the data is available at central control rooms, monitoring stations for reporting, central logging, sharing with cloud analytics, reporting and monitoring systems using MQTT.  Like all data sources, once the data is in DataHub, use any of DataHub's features with the data to derive business value. 

REQUEST QUOTE

Combine with TOP Server SNMP Suite to Access Network Infrastructure Health

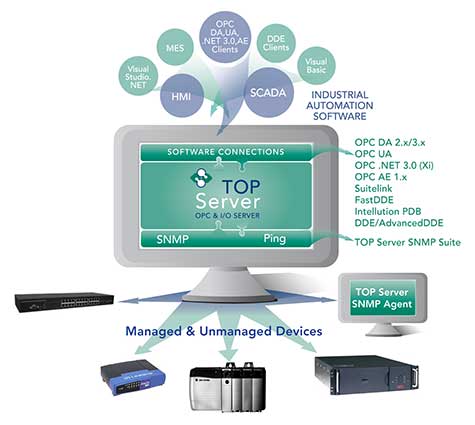
When you want to know more than just the data Windows Performance Counters offers, you can use the DataHub's ability to access any OPC DA or OPC UA server along with Software Toolbox's TOP Server SNMP Suite OPC DA & UA Server. Improve collaboration with IT when you make this data available to operations staff so when there is a problem, they can provide your IT experts with better data to go with their problem symptoms. 

The TOP Server SNMP Suite 

  • Monitors any managed IT infrastructure device supporting SNMP protocol
  • Examples include switches, routers, firewalls, UPS/battery backup and many more
  • Produces network traffic and health statistics that can be combined in DataHub with local system health data
  • Includes a Ping driver for monitoring the up/down status and responsiveness of non-managed IT devices 
  • Available in lite (1-15 devices) and large (not limited by license) options. 

In a solution monitoring multiple local system's health, put TOP Server SNMP Suite on one system, then use DataHub's mirroring/tunneling feature to distribute the network, power, & other infrastructure health to every other DataHub, for availability at any HMI or SCADA workstation to empower  your operators to self resolve issues or collaborate better with IT. 

The TOP Server SNMP Suite is not included with DataHub, but can be purchased online or combined on a system quote by requesting a quote below.  Have questions? Ask our experts. 

ASK AN EXPERT

REQUEST QUOTE

Get Started Now

This trial software is fully functioning and can be used to update licensed product provided you are on an active support & maintenance agreement.  Once DataHub is started it will run for 1 hour at a time, you can restart the application to reset this timer. Purchasing a license removes the limitation for licensed features. 

Connect with Us

1-888-665-3678 (US + Canada toll free)
+1-704-849-2773 (Global)
support.softwaretoolbox.com